Is Inflation as Scary as It Seems?


Today’s post was cowritten by Peter Essele, vice president of investment management and research.
In the big picture, the inflation we're now seeing could be a temporary phenomenon, driven by a much faster recovery from the pandemic than expected, combined with the usual snafus as the world economy tries to spin up quickly. Indeed, those effects are real.
But before we explore that idea further, my colleague Pete Essele suggested we first ask a better question: is that scary inflation print really as bad as it looks? In other words, before we start looking for reasons for the problem, perhaps we want to first make sure the problem is real. And when you break down the numbers? The inflation threat doesn’t look so bad after all.
Pete’s Take
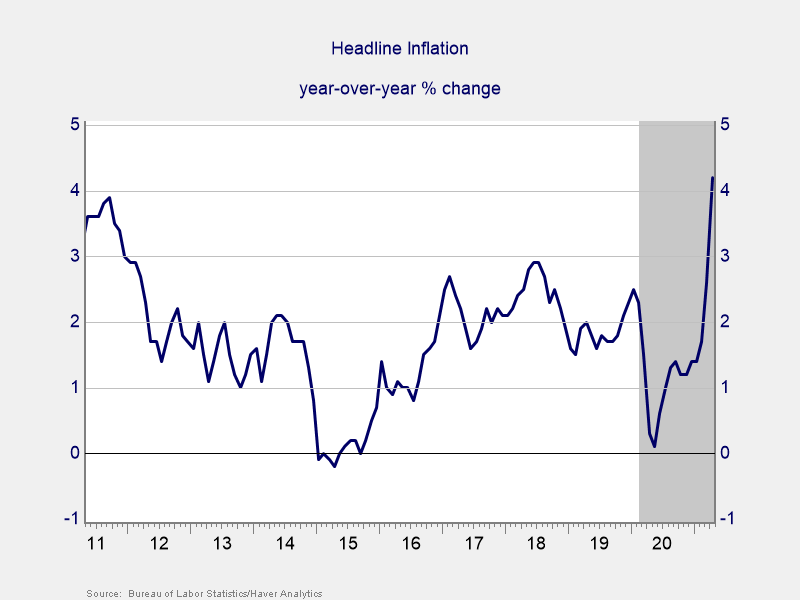
Last week’s inflation print (Consumer Price Index or CPI) came in at 4.2 percent year-over-year, the largest increase since 2008. Investors are now wondering if perhaps it makes sense to begin buying inflation-sensitive assets like TIPS (U.S. Treasury inflation-protected securities), commodities, and precious metals. Before doing so, it’s important to understand the numbers because, like many economic data points, the devil’s in the details. Let’s have a look.
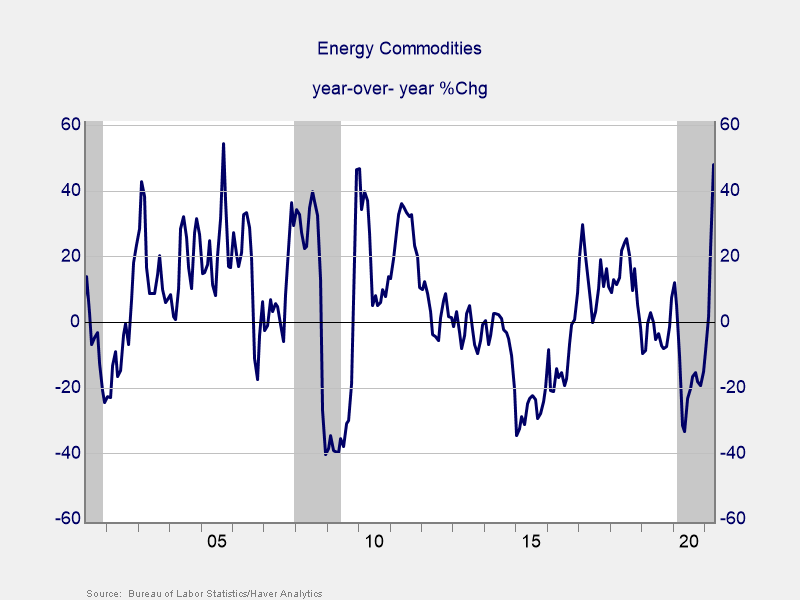
Headline inflation. Although the 4.2 percent rise in prices over the past year was a noteworthy print, the numbers suggest that it wasn’t a broad-based increase across all goods and services. In fact, of the major expenditure categories used to calculate the headline number, only a few came in above 4.2 percent. Energy commodities, used cars and trucks, and transportation services (specifically, airfare and vehicle insurance) stood out, which saw yearly price increases of 47.9 percent, 21 percent, and 5.6 percent, respectively. All other major expenditures were in line with long-term averages. The three aforementioned categories account for only 12 percent of the CPI basket of goods and services. Because they experienced such significant increases, the overall headline number was pulled higher, landing above recent averages. The largest component of CPI (shelter) came in at 2.1 percent, compared with a 10-year average of 2.76 percent.
Energy commodities. What also needs to be considered in the numbers, especially for energy commodities, is that current prices are being compared with a very low base, which makes year-over-year values look significant. For instance, the price of oil currently stands at pre-COVID levels ($62 per barrel) after plunging to low double digits in April 2020 as the economy came grinding to a halt. With improvements in the economic environment as of late, prices have started to normalize from historical lows. Therefore, a prudent investor should assess current price levels compared with long-term averages and not take the year-over-year increases at face value.
Brad Breaks It Down
Thanks, Pete. For those who got lost in the numbers, most items in the CPI came in under, in many cases well under, the 4.2 percent headline number. That scary print was largely due to a handful of categories that spiked, notably energy, after collapsing last year. In other words, that scary number was a one-off.
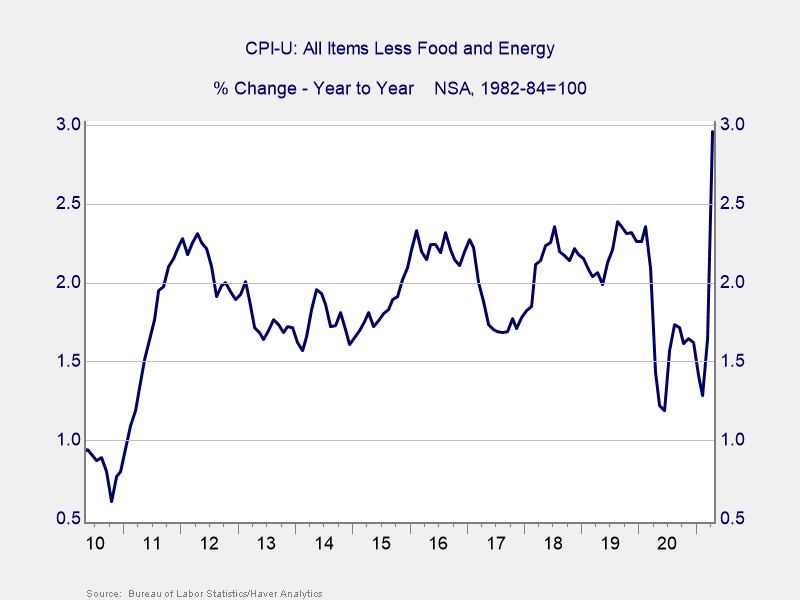
Core inflation. A simpler way to look at it is to take out food and energy from the headline number, which gets us to what is called core inflation. If we look at that, the 4.2 percent becomes 2.96 percent, which is still not great but is considerably less scary than the initial headline number. Energy alone accounts for a great deal of the increase, and that is due to the collapse and rebound in prices over the past year.
Overall change in price. All well and good, I hear you say, but I need to heat my home and fuel my car. I can’t take out energy! Fair enough. So let’s take out the energy price plunge last year and the recovery this year by going back and seeing what the overall change in prices has been over the past two years. And what we see, in the chart below, is that prices are up about 4 percent overall since two years ago, which is about the same as we saw in 2018 and 2019. If you take out the pandemic effects, inflation looks much like it did in 2019. This is not a surge in inflation; rather, it is a return to normal. Pete was quite right to ask the question because when we dig into the details, inflation is not nearly as scary as the headline number would suggest.

Inflation Not That Hot
Now there are signs that inflation could rise in the coming years. The infrastructure problems are real and will need time to correct. Labor shortages might become more common, which could drive up inflation. And as globalization slows or reverses, inflation will also likely rise. These are real concerns to watch for over the next couple of years.
But that is not what is happening now. When you dig into the numbers, inflation simply isn’t that hot. When you look over a longer period than the trough to peak of the past year, again, inflation simply isn’t that hot. And when you consider the real problems the global economy is dealing with, the surprise is that inflation is not higher.
Once again, remain calm and carry on.
Editor’s Note: The original version of this article appeared on the Independent Market Observer.

The information on this website is intended for informational/educational purposes only and should not be construed as investment advice, a solicitation, or a recommendation to buy or sell any security or investment product. Please contact your financial professional for more information specific to your situation.
Certain sections of this commentary contain forward-looking statements that are based on our reasonable expectations, estimates, projections, and assumptions. Forward-looking statements are not guarantees of future performance and involve certain risks and uncertainties, which are difficult to predict. Past performance is not indicative of future results. Diversification does not assure a profit or protect against loss in declining markets.
The S&P 500 Index is a broad-based measurement of changes in stock market conditions based on the average performance of 500 widely held common stocks. All indices are unmanaged and investors cannot invest directly into an index.
The MSCI EAFE (Europe, Australasia, Far East) Index is a free float‐adjusted market capitalization index that is designed to measure the equity market performance of developed markets, excluding the U.S. and Canada. The MSCI EAFE Index consists of 21 developed market country indices.
Third-party links are provided to you as a courtesy. We make no representation as to the completeness or accuracy of information provided at these websites. Information on such sites, including third-party links contained within, should not be construed as an endorsement or adoption by Commonwealth of any kind. You should consult with a financial advisor regarding your specific situation.
Please review our Terms of Use.