Young People in Fancy Cars

Have you noticed more high-end cars on the road these days? And do the drivers of these cars seem to be getting younger and younger? Of course, it might be just me noticing these things. I graduated from college not too long ago and consider myself fortunate to be driving my parents’ old Hyundai. Nonetheless, when I pull up to a light and look over to see someone about my age or younger driving the newest Mercedes or another nice car, I do start wondering. How can such a young person afford that car?
What’s Up with the Economy?
Grasping for an answer generally leads me to thoughts about what’s going on in the economy. (Yes, I work in finance and I do think like this.) First, when considering my own financial situation and that of my friends, I acknowledge that we’re fortunate to have jobs and able to live on our own. For the broader economy, the current numbers for unemployment and personal savings also look pretty good, as illustrated in the graph below. Unemployment is at a historical low, and people are saving more since the recession.
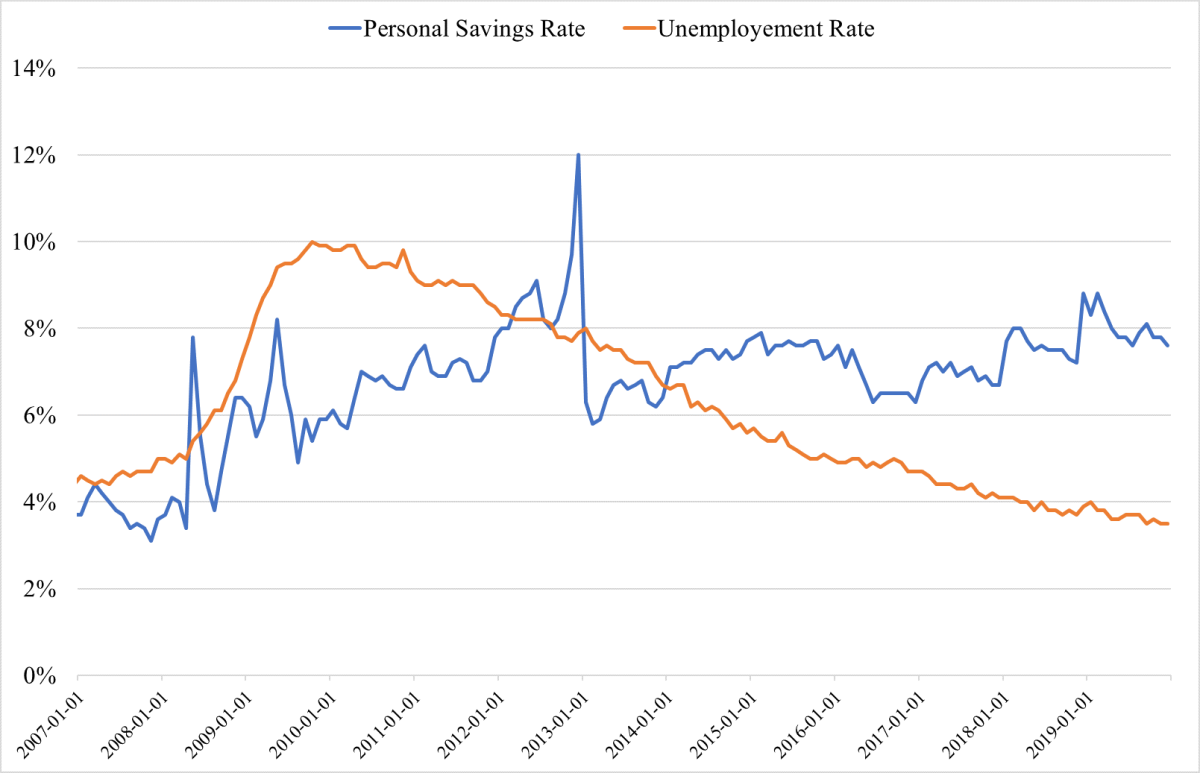
Source: Federal Reserve Bank of St. Louis
Looking Under the Hood
Although these data points paint a good picture of the economy, they do raise a question. If personal savings have increased considerably since the recession, how are people spending more on new cars? This seems like an odd dynamic between saving and spending. To explain it, we need to look under the hood, so to speak.
First, let’s investigate how people are buying new cars. As you can see in the graph below, people are starting to borrow more to acquire a car. Since the recession, the average amount borrowed to purchase a new vehicle has increased considerably. To add to this narrative, there’s been no shortage of stories about people being able to borrow more than the car they’re purchasing is worth.
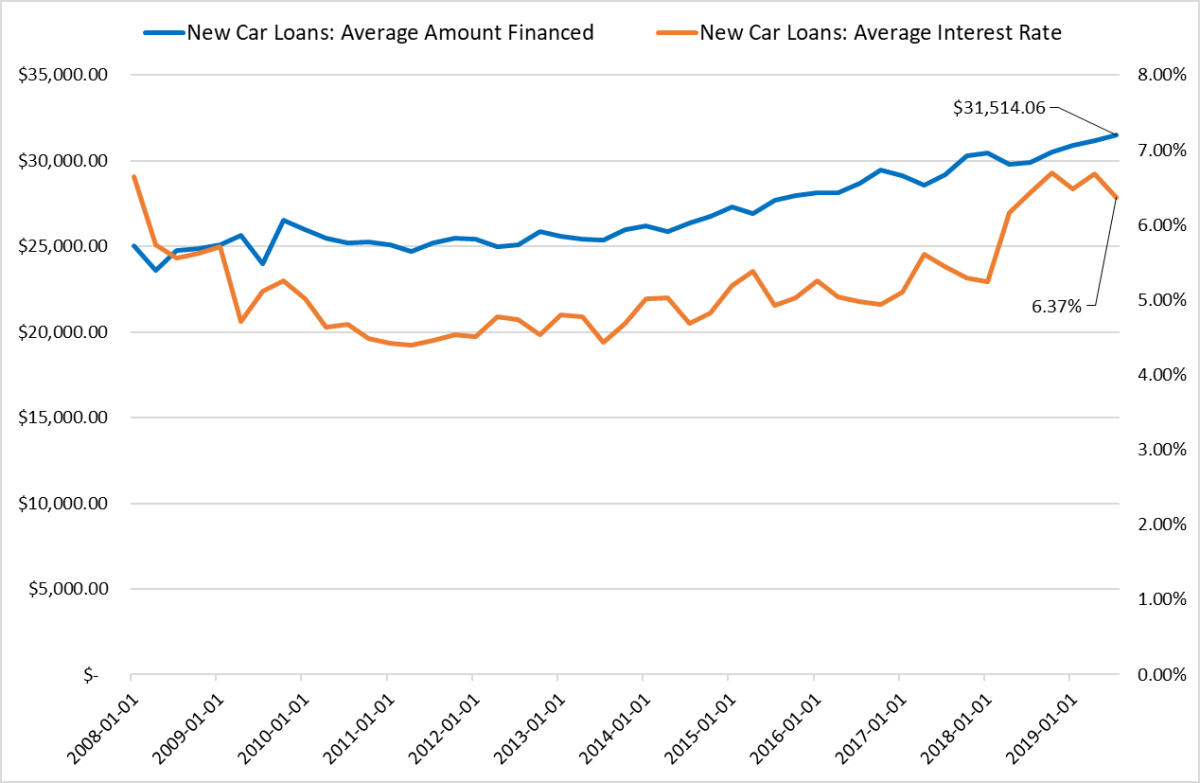
Source: Haver Analytics
Furthermore, during the time period in which the average loan size has increased, there’s been a rise in the average interest rate on new car loans. Higher rates put further pressure on borrowers, causing them to take out larger loans that come with higher monthly payments. How long can this relationship persist before we see increasing rates of consumer loan defaults?
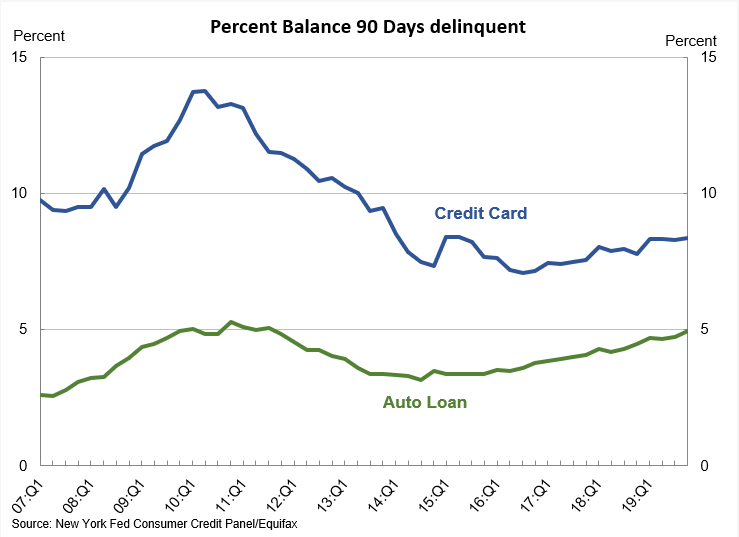
Not long—in fact, the trend is already underway. In the graph below provided by the Federal Reserve Bank of New York, we can see an increase in defaults in the auto loan space. Following the recession, the balance of defaulted auto loans and credit card loans dropped, but it’s slowly begun to go back up. The auto loan default rates are particularly interesting. At their current level of just under 5 percent, they’re very close to the peak seen during the recession. Meanwhile, credit card defaults, despite a slight uptick, are not even close to the peak hit in 2010.
What Does the Data Mean?
At a high level, the economy is doing well. On average, people are working and saving more. Consumer confidence remains quite high. As we can see from auto loan defaults, however, areas of the market bear watching. Obviously, just looking at average auto loans and auto defaults doesn’t tell the whole story. But these indicators provide a glimpse into potential behaviors and weakness that could have larger effects on the economy down the road.
Given the industry I work in, I probably look at the economy and finances a little differently than many people. When I reflect on consumer behavior and financial data, I wonder what I should learn from it. I’m still working things out. But one thing I know for sure is that I won’t be the young adult in a new, high-end car you pull up next to at a light. I plan to keep on saving my money and driving my handed-down Hyundai into the ground.
Editor’s Note: The original version of this article appeared on the Independent Market Observer.

The information on this website is intended for informational/educational purposes only and should not be construed as investment advice, a solicitation, or a recommendation to buy or sell any security or investment product. Please contact your financial professional for more information specific to your situation.
Certain sections of this commentary contain forward-looking statements that are based on our reasonable expectations, estimates, projections, and assumptions. Forward-looking statements are not guarantees of future performance and involve certain risks and uncertainties, which are difficult to predict. Past performance is not indicative of future results. Diversification does not assure a profit or protect against loss in declining markets.
The S&P 500 Index is a broad-based measurement of changes in stock market conditions based on the average performance of 500 widely held common stocks. All indices are unmanaged and investors cannot invest directly into an index.
The MSCI EAFE (Europe, Australasia, Far East) Index is a free float‐adjusted market capitalization index that is designed to measure the equity market performance of developed markets, excluding the U.S. and Canada. The MSCI EAFE Index consists of 21 developed market country indices.
Third-party links are provided to you as a courtesy. We make no representation as to the completeness or accuracy of information provided at these websites. Information on such sites, including third-party links contained within, should not be construed as an endorsement or adoption by Commonwealth of any kind. You should consult with a financial advisor regarding your specific situation.
Please review our Terms of Use.