Where Do Interest Rates Come From?


We closed yesterday’s post with the observation that economic theory doesn’t really have a good grip on where interest rates come from. Today, I want to explore where we think rates come from and what that might mean.
Does the Fed Control Rates?
The first, and simplest, way to look at interest rates is to conclude that the central banks set them. This, after all, is the underlying assumption behind the breathless coverage of the latest policy moves by the Fed or the European Central Bank. A headline like “Fed cuts rates” means something only if the Fed actually controls rates.
Looking at the data, though, it is clear the Fed does not have control here. From 2009 through 2016, the Fed kept rates at rock bottom, but longer-term rates bounced around considerably. The Fed no doubt had an influence, but it took years to work. And even when it seemed to be working (i.e., in 2016 through 2018, when longer rates lined up with Fed policy rates)? We saw that relationship blow up again in late 2018 as longer rates dropped again as Fed rates went up. In recent months, the Fed has been following not leading. The “Fed controls rates model” simply doesn’t work over any time frame shorter than a couple of years.
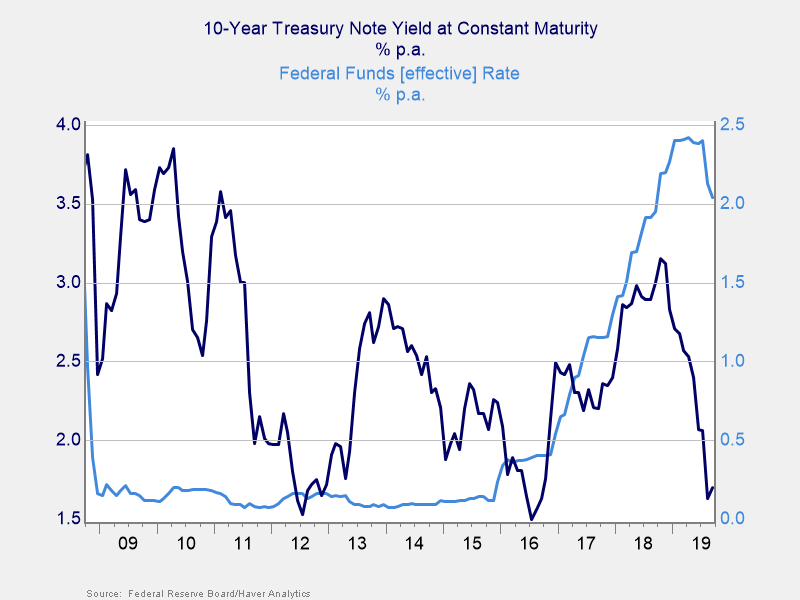
The Fed is aware of this dynamic, of course. What it is trying to do is signal and to exert that influence over a period of years. The Fed can’t—and doesn’t—set rates directly.
This is a good thing. When you think about it, the notion that the Fed sets rates is kind of a strange assumption. Interest rates are the foundation of the financial system. So the idea that they are set by a central planning board—the “Supreme Soviet,” as it were—is simply weird. If we are good capitalists and good economists, we would expect interest rates, as the price of money, to be set in the capital markets, at the intersection of supply and demand.
The Intersection of Supply and Demand
Which brings us to the second major model for where interest rates come from: the intersection of supply and demand of capital. Simply, if more capital is available and if demand is constant, then rates should decline. This idea provides a very reasonable model for why rates have been declining for decades (which, if you remember, is what we are trying to explain here).
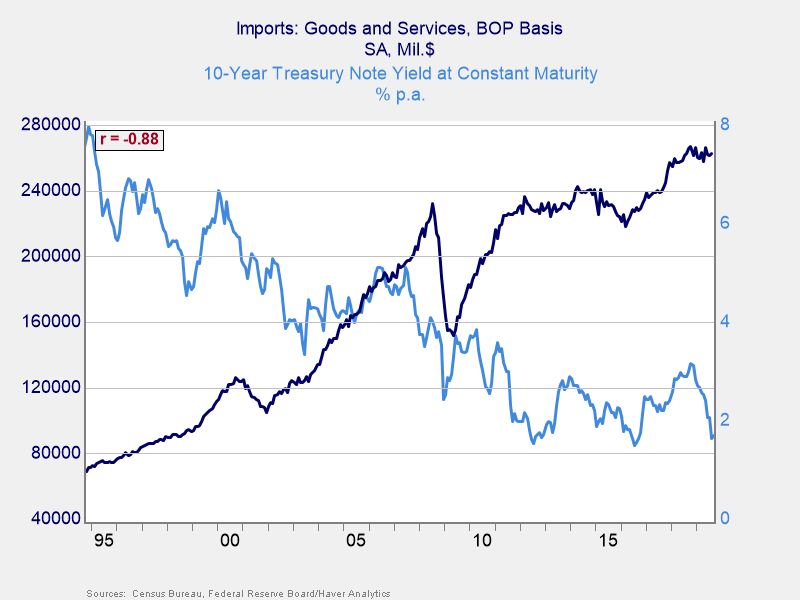
This model makes a lot of sense over that time frame. Rising imports to the U.S. created a need for the exporters to recycle their capital in dollar assets—U.S. Treasuries. Rising imports, therefore, led to more capital coming back to the U.S. You can see a near 90 percent correlation between rates and imports over that time period, which is incredibly high for economic data. A larger supply of capital led to lower cost of capital, just as theory predicts. When you look at the numbers, you have more than $2 trillion in Treasuries between China and Japan, and more held by other exporters. That is capital the U.S. would not have had access to, and it represents considerable additional supply.
This model clearly has some explanatory power, but it also has problems. It doesn’t, for example, explain the gaps between the U.S., Europe, and Japan. It also doesn’t explain the recent declines in rates. With global trade rolling over and with the U.S. trade war hitting imports (see the chart below), the supply of excess capital is declining, which should mean rates go up. Instead, we are seeing them go down again.
Clearly, there is something else going on.

The Missing Piece
Both of these models—central bank control and supply and demand—capture part of the story. We need another piece, however, to explain the gaps between markets and the recent declines. I think that something else is non-economic, specifically, demographics. Tomorrow, we will look at how I got to that conclusion and what it could mean for the future.
Editor’s Note: The original version of this article appeared on the Independent Market Observer.

The information on this website is intended for informational/educational purposes only and should not be construed as investment advice, a solicitation, or a recommendation to buy or sell any security or investment product. Please contact your financial professional for more information specific to your situation.
Certain sections of this commentary contain forward-looking statements that are based on our reasonable expectations, estimates, projections, and assumptions. Forward-looking statements are not guarantees of future performance and involve certain risks and uncertainties, which are difficult to predict. Past performance is not indicative of future results. Diversification does not assure a profit or protect against loss in declining markets.
The S&P 500 Index is a broad-based measurement of changes in stock market conditions based on the average performance of 500 widely held common stocks. All indices are unmanaged and investors cannot invest directly into an index.
The MSCI EAFE (Europe, Australasia, Far East) Index is a free float‐adjusted market capitalization index that is designed to measure the equity market performance of developed markets, excluding the U.S. and Canada. The MSCI EAFE Index consists of 21 developed market country indices.
Third-party links are provided to you as a courtesy. We make no representation as to the completeness or accuracy of information provided at these websites. Information on such sites, including third-party links contained within, should not be construed as an endorsement or adoption by Commonwealth of any kind. You should consult with a financial advisor regarding your specific situation.
Please review our Terms of Use.