My Portfolio Isn’t Beating the Market: Should It?


As a species, human beings love to compete with one another. I see this competitive nature on display every day with my six-year-old James and nine-year-old Max. Who can get up the stairs first? Who can finish their dinner first? Who gets to cuddle with daddy first? (Okay, full disclosure here, it’s usually a battle over who can cuddle with mommy!) Winning, doing better than someone else, and outperforming are in our blood. In many ways, this concept also applies to analyzing your portfolio’s investment performance. But to accurately determine outperformance, it’s important to compare your results against the proper standard or benchmark.
What Is Winning?
The other day after Max’s baseball game, James (full of liquid courage from drinking his blue slushy) challenged me to a race around the bases. Not being from the “participation trophy era” of today, I went full out and handily beat him. Now, my friends often joke that my legs are so skinny that people might chalk them up if I passed a pool hall. Nonetheless, it was not a “fair” race, as my legs are much longer and my body is more developed than my son’s. (I be old!) Of course, if James were to run against kids who were closer to his age, it would provide a much better litmus test of how fast he really is.
The same idea holds true for comparing the performance of your portfolio. Often, advisors request that I take a second look at a portfolio when clients ask about their returns compared with “the market.” For most investors, the market refers to the S&P 500. For the most part, this index is composed of large-cap U.S. equity. So, unless you own a similarly constructed portfolio, it is not a fair comparison.
Instead, a more appropriate benchmark is a blended index that includes the Russell 3000 (domestic equity), the MSCI World ex-U.S. (international equity), and the Bloomberg Barclays U.S. Aggregate Bond (bonds) indices, as well as cash. In addition, the percentage in each index should mirror a client’s actual allocation to domestic equities, international equities, bonds, and cash. To “win,” clients should evaluate whether their investments beat this blended benchmark.
Everybody Want to Rule the World
The above references a song from 1985 by Tears for Fears. It falls outside my top 1,000 favorite songs; however, it does speak to how the average investor wants to make as much as the market, as long as the market is up. It is also perfectly normal to have a short-term memory and forget that the S&P 500 was down 37 percent in 2008. Advisors work with clients to determine their risk tolerance and, in turn, the asset allocation that aligns with it. The more risk that you are willing to take on, the better the probability that your return will be higher because of it. Conversely, with higher risk comes a higher chance of more loss of principal when the market falls.
What Goes Around, Comes Around
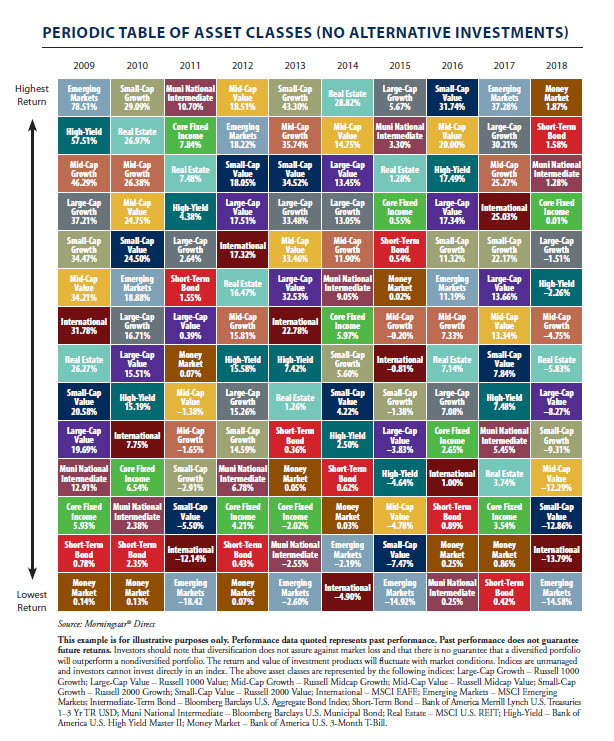
This brings us to the concept of diversification. With hindsight, it is not unusual for an investor to think, “why didn’t my advisor just put all my money into Amazon and Apple?!” Cue the reference to the dot-com bubble of 2000 that I witnessed firsthand as a stock trader. Now, I am not saying that today’s tech giants are analogous to those that crashed like Pets.com. But Newton’s law of gravity of what goes up must come down applies here. How much they go down is another story. The point is something that has been constantly emphasized with all investors: diversification is essential to long-term performance. Like the circle of life (the new Lion King now playing in a theater near you!), an asset class can do great one year and terrible the next. For instance, emerging markets equity was up 37.28 percent in 2017 and down 14.58 percent in 2018. The Callan chart below illustrates this concept best.
A Marathon . . . Not a Sprint
Back in 2000, I decided to run the Boston Marathon even though I had never run more than 5 miles at a time in my life. Shaped more like a rhombus than a runner, I realized that the only way that I could run 26.2 miles would be to run relatively slow and gradually build up my endurance. In the short run (pun intended!), my tortoise-like pace kept me in the back of the pack. In the long run? I was able to endure and finish the race, while others that were once ahead of me fell by the wayside. I had accomplished my goal.
Investing can be looked at in the same light. It is about accomplishing your goal, whether that's owning a home, putting your kids through college, or retiring at a certain age. You can only sprint for so long. The old adage of slow and steady wins the race applies here.
The Bottom Line
I teach my boys that it is okay to be competitive but that it is also okay to lose. Both, in the long run, will make them stronger and help them achieve their goals in life. They should measure their relative success or failure against appropriate benchmarks. Investors would do well to do the same.
Editor’s Note: The original version of this article appeared on the Independent Market Observer.

The information on this website is intended for informational/educational purposes only and should not be construed as investment advice, a solicitation, or a recommendation to buy or sell any security or investment product. Please contact your financial professional for more information specific to your situation.
Certain sections of this commentary contain forward-looking statements that are based on our reasonable expectations, estimates, projections, and assumptions. Forward-looking statements are not guarantees of future performance and involve certain risks and uncertainties, which are difficult to predict. Past performance is not indicative of future results. Diversification does not assure a profit or protect against loss in declining markets.
The S&P 500 Index is a broad-based measurement of changes in stock market conditions based on the average performance of 500 widely held common stocks. All indices are unmanaged and investors cannot invest directly into an index.
The MSCI EAFE (Europe, Australasia, Far East) Index is a free float‐adjusted market capitalization index that is designed to measure the equity market performance of developed markets, excluding the U.S. and Canada. The MSCI EAFE Index consists of 21 developed market country indices.
Third-party links are provided to you as a courtesy. We make no representation as to the completeness or accuracy of information provided at these websites. Information on such sites, including third-party links contained within, should not be construed as an endorsement or adoption by Commonwealth of any kind. You should consult with a financial advisor regarding your specific situation.
Please review our Terms of Use.