What Does an Un-Inverted Yield Curve Mean?


Today, we are going to do some “inside-baseball” analysis around the recent changes in interest rates and what they mean. Normally, I try not to get too far into the weeds here on the blog. But interest rates and the yield curve have gotten a lot of attention, and the recent headlines are not actually all that helpful. So, put on your thinking caps because we’re going to get a bit technical.
A Yield Curve Refresher
You may recall the inversion of the yield curve several months ago. It generated many headlines as a signal of a pending recession. To refresh, the yield curve is simply the different interest rates the U.S. government pays for different time periods. In a normal economic environment, longer time periods have higher rates, which makes sense as more can go wrong. Just as a 30-year mortgage costs more than a 10-year one, a 10-year bond should have a higher interest rate than one for, say, 3 months. A lot more can go wrong—inflation, slow growth, you name it—in 10 years than in 3 months.
That dynamic is in a normal economic environment. Sometimes, though, investors decide that those 10-year bonds are less risky than 3-month bonds, and the longer-term rates then drop below those for the short term. This change can happen for many reasons. The big reason is that investors see economic trouble ahead that will force down the rate on the 10-year bond. When this happens, the yield curve is said to be inverted (i.e., upside down) because those longer rates are lower than the shorter rates.
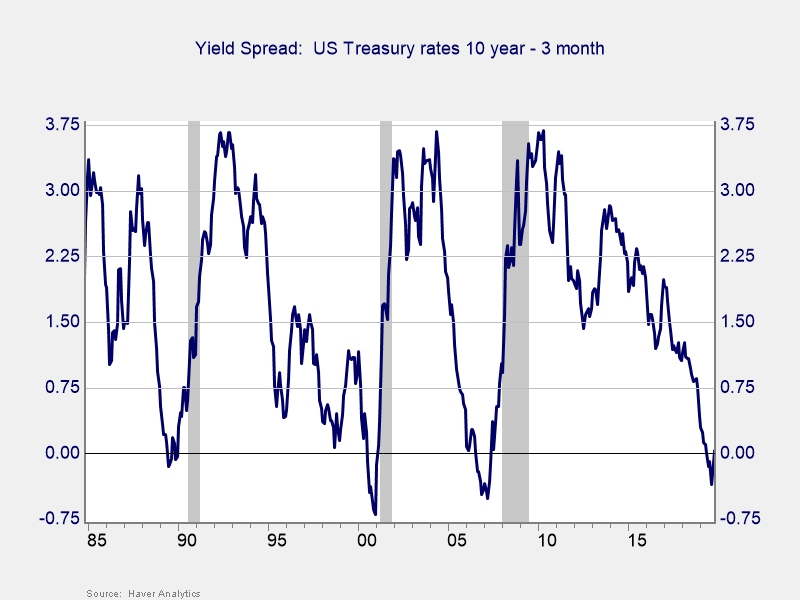
When investors decide that trouble is ahead, and the yield curve inverts, they tend to be right. The chart below subtracts 3-month rates from 10-year rates. When it goes below zero, the curve is inverted. As you can see, for the past 30 years, there has indeed been a recession within a couple of years after the inversion. This pattern is where the headlines come from, and they are often accurate. We need to pay attention.
Recently, however, the yield curve has un-inverted—which is to say that short-term rates are now below long-term rates. And that is where we need to take a closer look.
What Is the Un-Inversion Signaling?
On the surface, the fact that the yield curve is now normal suggests that the bond markets are more optimistic about the future, which should mean the risk of a recession has declined. Much of the recent coverage has suggested this scenario, but it is not the case.
From a theoretical perspective, the bond markets are still pricing in that recession, but now they are also looking forward to the recovery. If you look again at the chart above, just as the initial inversion led the recession by a year or two, the un-inversion preceded the end of the recession by about the same amount. The un-inversion does indeed signal an economic recovery—but it doesn’t mean we won’t have to get through a recession first.
In fact, when the yield curve un-inverts, it is signaling that the recession is closer (within one year based on the past three recessions). While the inversion says trouble is coming in the medium term, the un-inversion says trouble is coming within a year. Again, this idea is consistent with the signaling from the bond markets, as recessions typically last a year or less. The recent un-inversion, therefore, is a signal that a recession may be closer than we think, not a signal we are in the clear.
Countdown to Recession?
A recession in the next year is not guaranteed, of course. You can make a good case that we won’t get a recession until the spread widens to 75 bps, which is what we have seen in the past. It could take a good while to get to that point. You can also make a good case that with rates as low as they are, the yield curve is simply a less accurate indicator, and that may be right, too.
If you look at the past 30 years, however, you have to at least consider the possibility that the countdown has started. And that is something we need to be aware of.
Editor’s Note: The original version of this article appeared on the Independent Market Observer.

The information on this website is intended for informational/educational purposes only and should not be construed as investment advice, a solicitation, or a recommendation to buy or sell any security or investment product. Please contact your financial professional for more information specific to your situation.
Certain sections of this commentary contain forward-looking statements that are based on our reasonable expectations, estimates, projections, and assumptions. Forward-looking statements are not guarantees of future performance and involve certain risks and uncertainties, which are difficult to predict. Past performance is not indicative of future results. Diversification does not assure a profit or protect against loss in declining markets.
The S&P 500 Index is a broad-based measurement of changes in stock market conditions based on the average performance of 500 widely held common stocks. All indices are unmanaged and investors cannot invest directly into an index.
The MSCI EAFE (Europe, Australasia, Far East) Index is a free float‐adjusted market capitalization index that is designed to measure the equity market performance of developed markets, excluding the U.S. and Canada. The MSCI EAFE Index consists of 21 developed market country indices.
Third-party links are provided to you as a courtesy. We make no representation as to the completeness or accuracy of information provided at these websites. Information on such sites, including third-party links contained within, should not be construed as an endorsement or adoption by Commonwealth of any kind. You should consult with a financial advisor regarding your specific situation.
Please review our Terms of Use.